The basic game mechanic of Savage Worlds involves trying to roll a target number or better with a 4, 6, 8, 10, or 12-sided die.
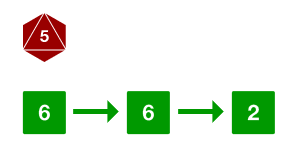
The die can ace if the player rolls the maximum number on it, allowing the player to roll again, adding the result to their original roll. In other games, this mechanic is often referred to as exploding dice or open-ended dice, as the player may continue to roll until they do not roll the max value. For example, if you rolled an 8 on an 8-sided die, you could keep rolling until you did not roll an 8.
Additionally, player characters and powerful non-player characters are considered wild cards. Wild cards roll an additional wild die, typically a 6-sided die, and the player uses the better of the two rolls. This wild die can also ace. For example, if you rolled another 8-sided die along with a wild die, you might get a higher result on the d6 than the d8.
As mentioned on other sites, this makes for some interesting probabilities. However, many of these articles either don’t provide a way to calculate the odds of these mechanics, or they provide a more mathematical explanation that might be hard to comprehend if you’ve been out of college for a while like myself.
This article attempts to explain these probabilities in a more accessible way using a close analog to dice, rational numbers in the form of fractions, along with some Python code to aid in calculating probabilities easily.
Exploding Die Probability
The probability of hitting a given number on a die expressed as a rational number is the number of values that will succeed over the number of sides the die has. For example, the probability of hitting an 8 on a d8 is 1/8. Only rolling an 8 is a success. Dividing 1 by 8 and multiplying by 100% gives us a decimal probability of 12.5%. The probability of hitting a 6 or better on a d8 is 3/8, or 37.5%, as rolling a 6, 7, or 8 are all considered successes.
The probability of hitting a 10 on an exploding d8 involves two independent events: first rolling an 8, then rolling a 2 or better. The probability of independent events involves multiplying the probability of the events together.1
[latex]P(E ∩ F) = P(E) × P(F)\\[/latex]
The chance of rolling the first 8 is 1/8, while the chance of rolling a 2 or better is 7/8 (any value but 1 succeeds). Thus, the chance of rolling a 10 with an exploding d8 is:
[latex]P = \frac{1}{8}\times\frac{7}{8} = \frac{7}{64} = \textbf{10.9375%}\\[/latex]
Python contains a fractions module that makes coding this trivial.
[python]
from fractions import Fraction
def exploding(target, sides):
exact, remainder = divmod(target, sides)
exact_roll_prob = Fraction(1, pow(sides, exact)) # 1/n + 1/n + …
last_roll_prob = Fraction(sides – (max(remainder, 1) – 1), sides)
return exact_roll_prob * last_roll_prob
[/python]
You can compare the results of your calculations using tools such as Troll. Values may not match exactly, however. The code above performs its calculations with rational numbers before converting to floating point values for the final answer. If we were to use floating point numbers for the calculations as well, rounding errors due to floating point math imprecision would introduce small variances in the answer. This is most likely what is happening with Troll.
Wild Die Probability
The probability of hitting a 10 with an exploding d8 and an exploding d6 wild die involves a union of events that are not mutually exclusive. The probability of mutually exclusive events involves adding the probability of the events together. However, we’re not done yet. There is a chance that you’ll hit with both die, and we don’t want to count the probability of hitting the target with both dice when just one of them counts as a success. So to get an accurate probability, we need to add the probability of hitting with either die and subtract the chance of hitting both.
[latex]P(E ∪ F) = P(E) + P(F) − P(E ∩ F)\\[/latex]
The probability of hitting a 10 with a d8 and a d6 wild die as described earlier is
[latex]P(E) = \frac{1}{8}\times\frac{7}{8} = \frac{7}{64} = 10.9375\%\\[/latex]
[latex]P(F) = \frac{1}{6}\times\frac{3}{6} = \frac{3}{36} = 8.3333\%\\[/latex]
[latex]P(E ∩ F) = \frac{7}{64}\times\frac{3}{36} = \frac{21}{2304} = 0.9114\%\\[/latex]
[latex]P(E ∪ F) = \frac{7}{64}+\frac{3}{36}-\frac{21}{2304} = \frac{47}{256} = \textbf{18.3593%}\\[/latex]
The Python code to calculate the probability of hitting a target number or better with a given dice and a wild die builds upon the code for exploding die.
[python]
def wild(target, sides, wild=6):
a = exploding(target, sides)
b = exploding(target, wild)
return a + b – (a * b)
[/python]
With the two Python functions, you can accurately calculate the probabilities to hit a range of target numbers with assorted dice.
[chartboot version= ‘2.3’ code= ‘3CEB’ border= ‘1’ width= ‘725’ height= ‘400’ attribution= ‘0’ jsondesc= ‘{“containerId”:”visualization3CEB”,”dataTable”:{“cols”:^{“id”:””,”label”:”Target”,”pattern”:””,”type”:”string”},{“id”:””,”label”:”d4″,”pattern”:””,”type”:”number”},{“id”:””,”label”:”d6″,”pattern”:””,”type”:”number”},{“id”:””,”label”:”d8″,”pattern”:””,”type”:”number”},{“id”:””,”label”:”d10″,”pattern”:””,”type”:”number”},{“id”:””,”label”:”d12″,”pattern”:””,”type”:”number”}|,”rows”:^{“c”:^{“v”:”1″,”f”:null},{“v”:1,”f”:null},{“v”:1,”f”:null},{“v”:1,”f”:null},{“v”:1,”f”:null},{“v”:1,”f”:null}|},{“c”:^{“v”:”2″,”f”:null},{“v”:0.75,”f”:null},{“v”:0.833333333,”f”:null},{“v”:0.875,”f”:null},{“v”:0.9,”f”:null},{“v”:0.916666667,”f”:null}|},{“c”:^{“v”:”3″,”f”:null},{“v”:0.5,”f”:null},{“v”:0.666666667,”f”:null},{“v”:0.75,”f”:null},{“v”:0.8,”f”:null},{“v”:0.833333333,”f”:null}|},{“c”:^{“v”:”4″,”f”:null},{“v”:0.25,”f”:null},{“v”:0.5,”f”:null},{“v”:0.625,”f”:null},{“v”:0.7,”f”:null},{“v”:0.75,”f”:null}|},{“c”:^{“v”:”5″,”f”:null},{“v”:0.25,”f”:null},{“v”:0.333333333,”f”:null},{“v”:0.5,”f”:null},{“v”:0.6,”f”:null},{“v”:0.666666667,”f”:null}|},{“c”:^{“v”:”6″,”f”:null},{“v”:0.1875,”f”:null},{“v”:0.166666667,”f”:null},{“v”:0.375,”f”:null},{“v”:0.5,”f”:null},{“v”:0.583333333,”f”:null}|},{“c”:^{“v”:”7″,”f”:null},{“v”:0.125,”f”:null},{“v”:0.166666667,”f”:null},{“v”:0.25,”f”:null},{“v”:0.4,”f”:null},{“v”:0.5,”f”:null}|},{“c”:^{“v”:”8″,”f”:null},{“v”:0.0625,”f”:null},{“v”:0.138888889,”f”:null},{“v”:0.125,”f”:null},{“v”:0.3,”f”:null},{“v”:0.416666667,”f”:null}|},{“c”:^{“v”:”9″,”f”:null},{“v”:0.0625,”f”:null},{“v”:0.111111111,”f”:null},{“v”:0.125,”f”:null},{“v”:0.2,”f”:null},{“v”:0.333333333,”f”:null}|},{“c”:^{“v”:”10″,”f”:null},{“v”:0.046875,”f”:null},{“v”:0.083333333,”f”:null},{“v”:0.109375,”f”:null},{“v”:0.1,”f”:null},{“v”:0.25,”f”:null}|},{“c”:^{“v”:”11″,”f”:null},{“v”:0.03125,”f”:null},{“v”:0.055555556,”f”:null},{“v”:0.09375,”f”:null},{“v”:0.1,”f”:null},{“v”:0.166666667,”f”:null}|},{“c”:^{“v”:”12″,”f”:null},{“v”:0.015625,”f”:null},{“v”:0.027777778,”f”:null},{“v”:0.078125,”f”:null},{“v”:0.09,”f”:null},{“v”:0.083333333,”f”:null}|},{“c”:^{“v”:”13″,”f”:null},{“v”:0.015625,”f”:null},{“v”:0.027777778,”f”:null},{“v”:0.0625,”f”:null},{“v”:0.08,”f”:null},{“v”:0.083333333,”f”:null}|},{“c”:^{“v”:”14″,”f”:null},{“v”:0.01171875,”f”:null},{“v”:0.023148148,”f”:null},{“v”:0.046875,”f”:null},{“v”:0.07,”f”:null},{“v”:0.076388889,”f”:null}|},{“c”:^{“v”:”15″,”f”:null},{“v”:0.0078125,”f”:null},{“v”:0.018518519,”f”:null},{“v”:0.03125,”f”:null},{“v”:0.06,”f”:null},{“v”:0.069444444,”f”:null}|},{“c”:^{“v”:”16″,”f”:null},{“v”:0.00390625,”f”:null},{“v”:0.013888889,”f”:null},{“v”:0.015625,”f”:null},{“v”:0.05,”f”:null},{“v”:0.0625,”f”:null}|},{“c”:^{“v”:”17″,”f”:null},{“v”:0.00390625,”f”:null},{“v”:0.009259259,”f”:null},{“v”:0.015625,”f”:null},{“v”:0.04,”f”:null},{“v”:0.055555556,”f”:null}|},{“c”:^{“v”:”18″,”f”:null},{“v”:0.002929688,”f”:null},{“v”:0.00462963,”f”:null},{“v”:0.013671875,”f”:null},{“v”:0.03,”f”:null},{“v”:0.048611111,”f”:null}|},{“c”:^{“v”:”19″,”f”:null},{“v”:0.001953125,”f”:null},{“v”:0.00462963,”f”:null},{“v”:0.01171875,”f”:null},{“v”:0.02,”f”:null},{“v”:0.041666667,”f”:null}|},{“c”:^{“v”:”20″,”f”:null},{“v”:0.000976563,”f”:null},{“v”:0.003858025,”f”:null},{“v”:0.009765625,”f”:null},{“v”:0.01,”f”:null},{“v”:0.034722222,”f”:null}|}|,”p”:null},”options”:{“legend”:”right”,”title”:”Exploding Die Probabilities”,”curveType”:””,”vAxes”:^{“title”:”Probability”,”minValue”:null,”maxValue”:null,”viewWindow”:{“max”:null,”min”:null},”useFormatFromData”:true},{“viewWindow”:{“max”:null,”min”:null},”minValue”:null,”maxValue”:null,”useFormatFromData”:true}|,”animation”:{“duration”:500},”booleanRole”:”certainty”,”lineWidth”:2,”hAxis”:{“minValue”:null,”maxValue”:null,”viewWindow”:null,”viewWindowMode”:null,”useFormatFromData”:true,”title”:”Targets”}},”state”:{},”isDefaultVisualization”:true,”chartType”:”LineChart”}’ ]
[chartboot version= ‘2.3’ code= ‘9513’ border= ‘1’ width= ‘725’ height= ‘400’ attribution= ‘0’ jsondesc= ‘{“containerId”:”visualization9513″,”dataTable”:{“cols”:^{“id”:””,”label”:”Target”,”pattern”:””,”type”:”string”},{“id”:””,”label”:”d4″,”pattern”:””,”type”:”number”},{“id”:””,”label”:”d6″,”pattern”:””,”type”:”number”},{“id”:””,”label”:”d8″,”pattern”:””,”type”:”number”},{“id”:””,”label”:”d10″,”pattern”:””,”type”:”number”},{“id”:””,”label”:”d12″,”pattern”:””,”type”:”number”}|,”rows”:^{“c”:^{“v”:”1″,”f”:null},{“v”:1,”f”:null},{“v”:1,”f”:null},{“v”:1,”f”:null},{“v”:1,”f”:null},{“v”:1,”f”:null}|},{“c”:^{“v”:”2″,”f”:null},{“v”:0.958333333,”f”:null},{“v”:0.972222222,”f”:null},{“v”:0.979166667,”f”:null},{“v”:0.983333333,”f”:null},{“v”:0.986111111,”f”:null}|},{“c”:^{“v”:”3″,”f”:null},{“v”:0.833333333,”f”:null},{“v”:0.888888889,”f”:null},{“v”:0.916666667,”f”:null},{“v”:0.933333333,”f”:null},{“v”:0.944444444,”f”:null}|},{“c”:^{“v”:”4″,”f”:null},{“v”:0.625,”f”:null},{“v”:0.75,”f”:null},{“v”:0.8125,”f”:null},{“v”:0.85,”f”:null},{“v”:0.875,”f”:null}|},{“c”:^{“v”:”5″,”f”:null},{“v”:0.5,”f”:null},{“v”:0.555555556,”f”:null},{“v”:0.666666667,”f”:null},{“v”:0.733333333,”f”:null},{“v”:0.777777778,”f”:null}|},{“c”:^{“v”:”6″,”f”:null},{“v”:0.322916667,”f”:null},{“v”:0.305555556,”f”:null},{“v”:0.479166667,”f”:null},{“v”:0.583333333,”f”:null},{“v”:0.652777778,”f”:null}|},{“c”:^{“v”:”7″,”f”:null},{“v”:0.270833333,”f”:null},{“v”:0.305555556,”f”:null},{“v”:0.375,”f”:null},{“v”:0.5,”f”:null},{“v”:0.583333333,”f”:null}|},{“c”:^{“v”:”8″,”f”:null},{“v”:0.192708333,”f”:null},{“v”:0.258487654,”f”:null},{“v”:0.246527778,”f”:null},{“v”:0.397222222,”f”:null},{“v”:0.497685185,”f”:null}|},{“c”:^{“v”:”9″,”f”:null},{“v”:0.166666667,”f”:null},{“v”:0.209876543,”f”:null},{“v”:0.222222222,”f”:null},{“v”:0.288888889,”f”:null},{“v”:0.407407407,”f”:null}|},{“c”:^{“v”:”10″,”f”:null},{“v”:0.126302083,”f”:null},{“v”:0.159722222,”f”:null},{“v”:0.18359375,”f”:null},{“v”:0.175,”f”:null},{“v”:0.3125,”f”:null}|},{“c”:^{“v”:”11″,”f”:null},{“v”:0.085069444,”f”:null},{“v”:0.108024691,”f”:null},{“v”:0.144097222,”f”:null},{“v”:0.15,”f”:null},{“v”:0.212962963,”f”:null}|},{“c”:^{“v”:”12″,”f”:null},{“v”:0.04296875,”f”:null},{“v”:0.054783951,”f”:null},{“v”:0.103732639,”f”:null},{“v”:0.115277778,”f”:null},{“v”:0.108796296,”f”:null}|},{“c”:^{“v”:”13″,”f”:null},{“v”:0.04296875,”f”:null},{“v”:0.054783951,”f”:null},{“v”:0.088541667,”f”:null},{“v”:0.105555556,”f”:null},{“v”:0.108796296,”f”:null}|},{“c”:^{“v”:”14″,”f”:null},{“v”:0.034595631,”f”:null},{“v”:0.04576046,”f”:null},{“v”:0.068938079,”f”:null},{“v”:0.091527778,”f”:null},{“v”:0.097768776,”f”:null}|},{“c”:^{“v”:”15″,”f”:null},{“v”:0.026186343,”f”:null},{“v”:0.036694102,”f”:null},{“v”:0.049189815,”f”:null},{“v”:0.077407407,”f”:null},{“v”:0.086676955,”f”:null}|},{“c”:^{“v”:”16″,”f”:null},{“v”:0.017740885,”f”:null},{“v”:0.027584877,”f”:null},{“v”:0.029296875,”f”:null},{“v”:0.063194444,”f”:null},{“v”:0.075520833,”f”:null}|},{“c”:^{“v”:”17″,”f”:null},{“v”:0.01312934,”f”:null},{“v”:0.018432785,”f”:null},{“v”:0.024739583,”f”:null},{“v”:0.048888889,”f”:null},{“v”:0.064300412,”f”:null}|},{“c”:^{“v”:”18″,”f”:null},{“v”:0.007545754,”f”:null},{“v”:0.009237826,”f”:null},{“v”:0.018238209,”f”:null},{“v”:0.034490741,”f”:null},{“v”:0.053015689,”f”:null}|},{“c”:^{“v”:”19″,”f”:null},{“v”:0.006573712,”f”:null},{“v”:0.009237826,”f”:null},{“v”:0.016294126,”f”:null},{“v”:0.024537037,”f”:null},{“v”:0.046103395,”f”:null}|},{“c”:^{“v”:”20″,”f”:null},{“v”:0.00483082,”f”:null},{“v”:0.007701165,”f”:null},{“v”:0.013585974,”f”:null},{“v”:0.013819444,”f”:null},{“v”:0.038446288,”f”:null}|}|,”p”:null},”options”:{“legend”:”right”,”title”:”Wild Die Probabilities”,”curveType”:””,”vAxes”:^{“title”:”Probability”,”minValue”:null,”maxValue”:null,”viewWindow”:{“max”:null,”min”:null},”useFormatFromData”:true},{“viewWindow”:{“max”:null,”min”:null},”minValue”:null,”maxValue”:null,”useFormatFromData”:true}|,”animation”:{“duration”:500},”booleanRole”:”certainty”,”lineWidth”:2,”hAxis”:{“minValue”:null,”maxValue”:null,”viewWindow”:null,”viewWindowMode”:null,”useFormatFromData”:true,”title”:”Targets”}},”state”:{},”view”:{},”isDefaultVisualization”:true,”chartType”:”LineChart”}’ ]
Resources and References
Statistics in a Nutshell, 2nd Edition
Chapter 2 of O’Reilly’s Statistics in a Nutshell covers probability and was a useful resource in understanding the math from a more practical angle. Specifically useful was the section on calculating the probability of mutually exclusive events starting on page 32.
Python Code and Chart Data
The Python code for this article can be found in a single script in this gist. The data for the charts above was created using the script as is available in this CSV file. The script has been tested with Python 2.7.3 and 3.3.0.


Thanks for this Dale!
totally dig the o’reilly book. I keep a copy on my ipad to refrence.