I’ve attempted twice to switch from WordPress to a statically generated site using one of the various tools available including Pelican, Octopress, and Jekyll. I find editing blog posts online to be an impediment for some reason. When I saw that a new version of Blogo had been released at half-price, I decided to take the plunge and try it out. This is my first post with it.
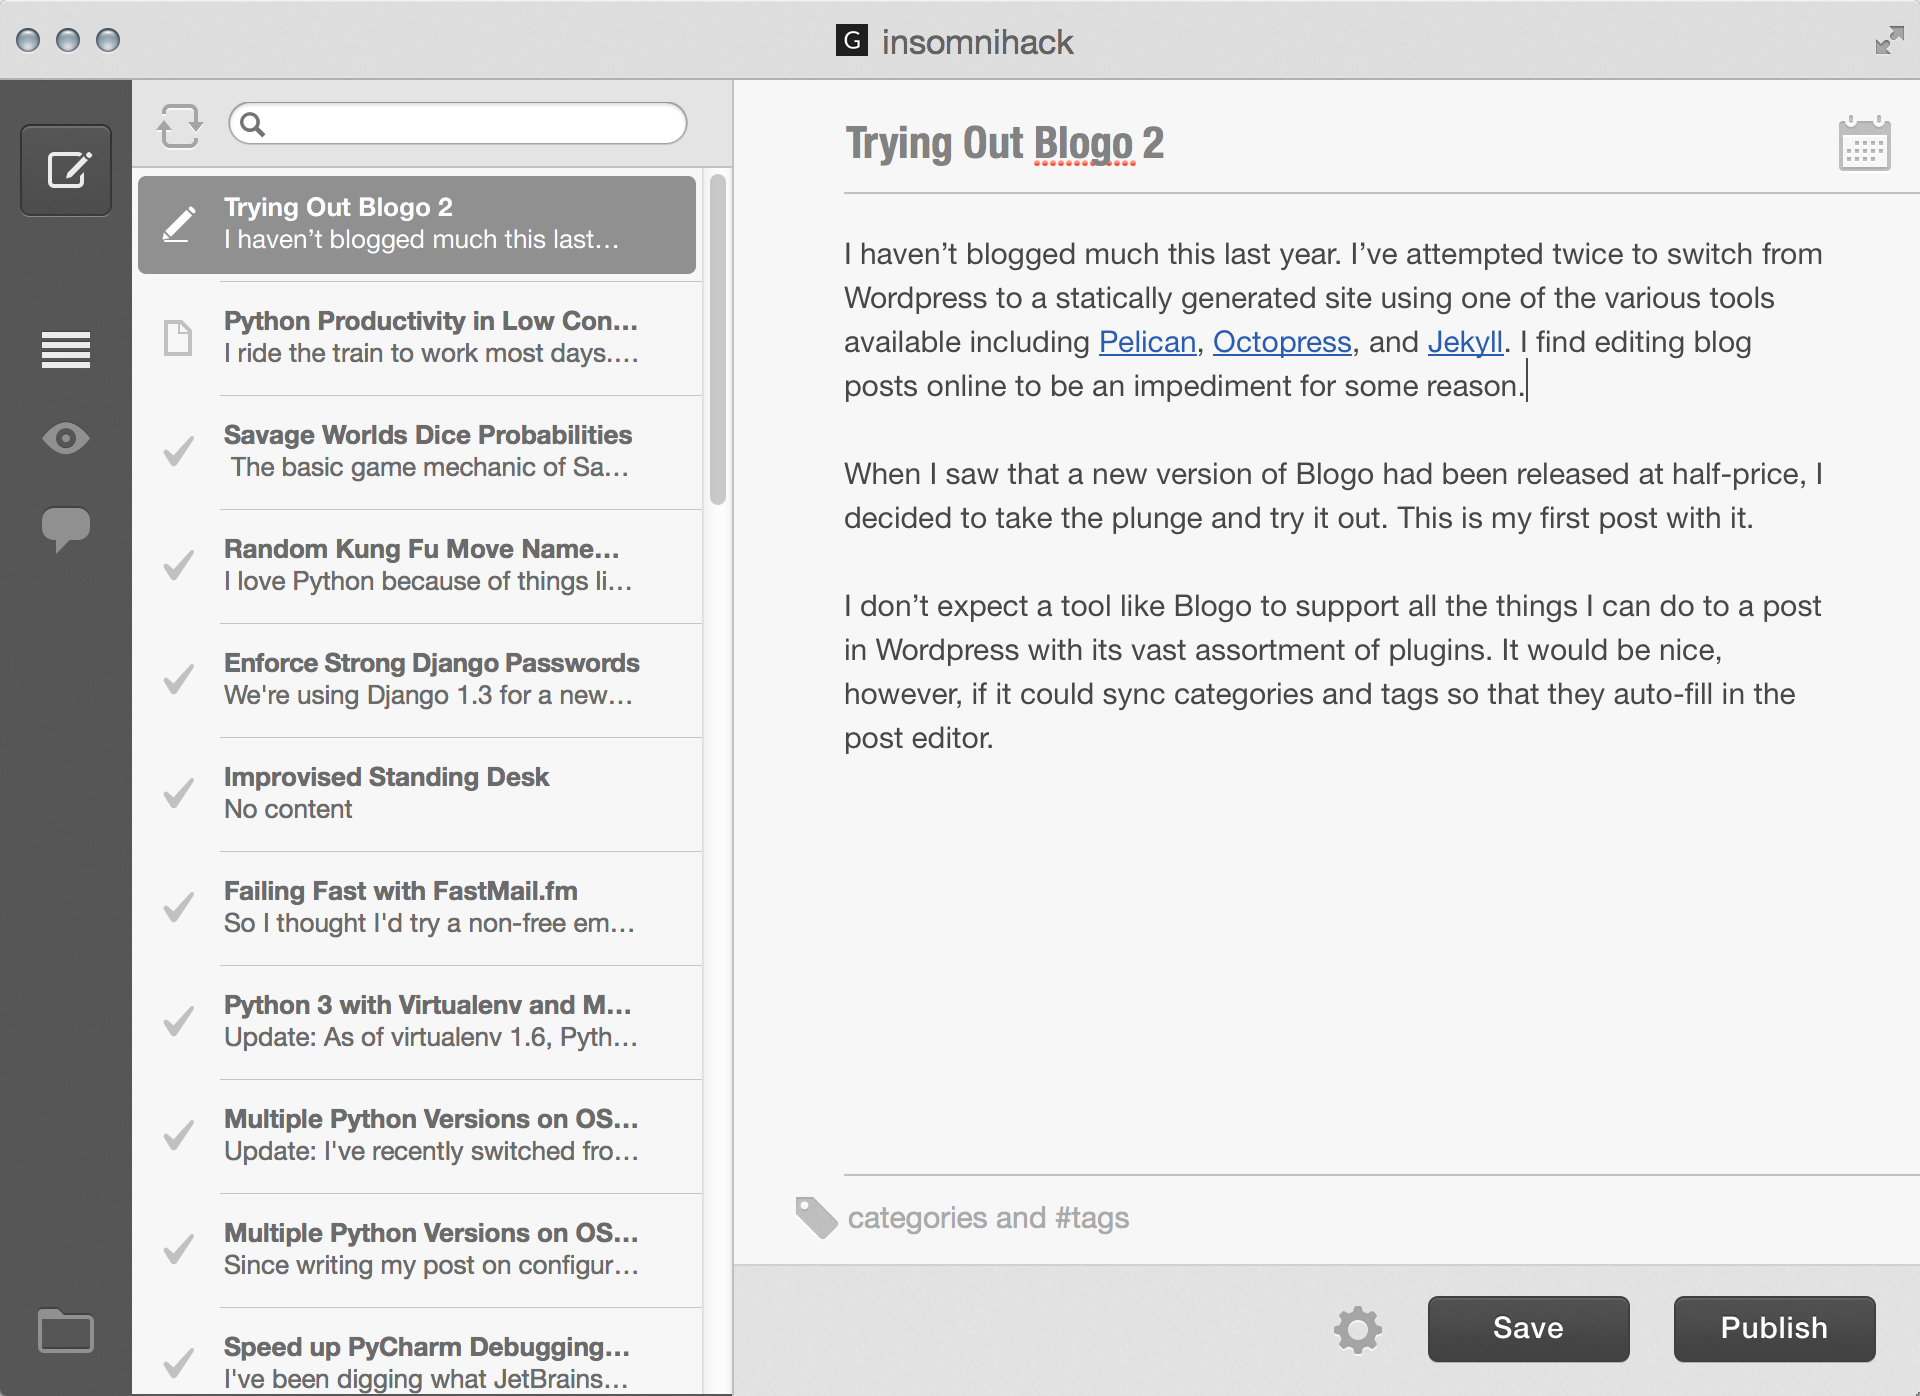
At first, I liked it. It doesn’t offer a ton of features, but that’s OK. I don’t expect a tool like Blogo to support all the things I can do to a post in WordPress with its vast assortment of plugins. I don’t mind having to jump into WordPress for things like code snippets and other things that require plug-in functionality. It would be nice, however, if it could sync categories and tags so that they auto-fill in the post editor so that I don’t have to go to my site to remember if my Python tag was capitalized or not. Getting images where I wanted them in the post, however, was frustrating.
My first attempt to post this article was not a success.
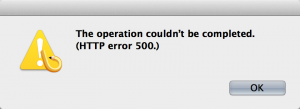
This was odd, because Preview worked just fine. I pinged the Blogo folks, and they asked me to try posting without images, which seemed to work. I updated the permissions on my wp-contnet/uploads folder and tried again. This time, it got some of the images uploaded with automatically generated names, but then kind of hung there. I never did get the post fully updated, and in the end, had to drop back into WordPress to get the post finished. Its too bad. I had high hopes for Blogo 2.
